

Real-time performance tracking for energy management decisions
A powerful platform that gives you an in-depth, real-time view of your energy assets, owned or third-party, across diverse energy markets. Built to provide actionable insights, it is an indispensable tool for energy producers, operators and asset managers seeking to optimize performance and maximize revenues.
What is Energy Tracker™
- Comprehensive asset performance monitoring
- An in-depth, real-time view of your assets, owned or third-party, catalogued by technology and with the markets each one takes part in.
- Real-time market insights
- Official data straight from the market operators, OMIE and REE, updated daily.
- Revenue breakdown and analytics
- Revenue and dispatched energy broken down by day, month or year, and market by market.
- Customizable user access
- Personalized accounts and flexible access for each user, over owned assets and the ones you manage for others.
- Strategic planning support
- The revenue detail and the market comparison that back the decisions on where each asset should be operating.
Inside the platform
What you see inside the platform: where each asset’s revenue comes from, how much energy went to each market, and how the market it competes in is behaving.
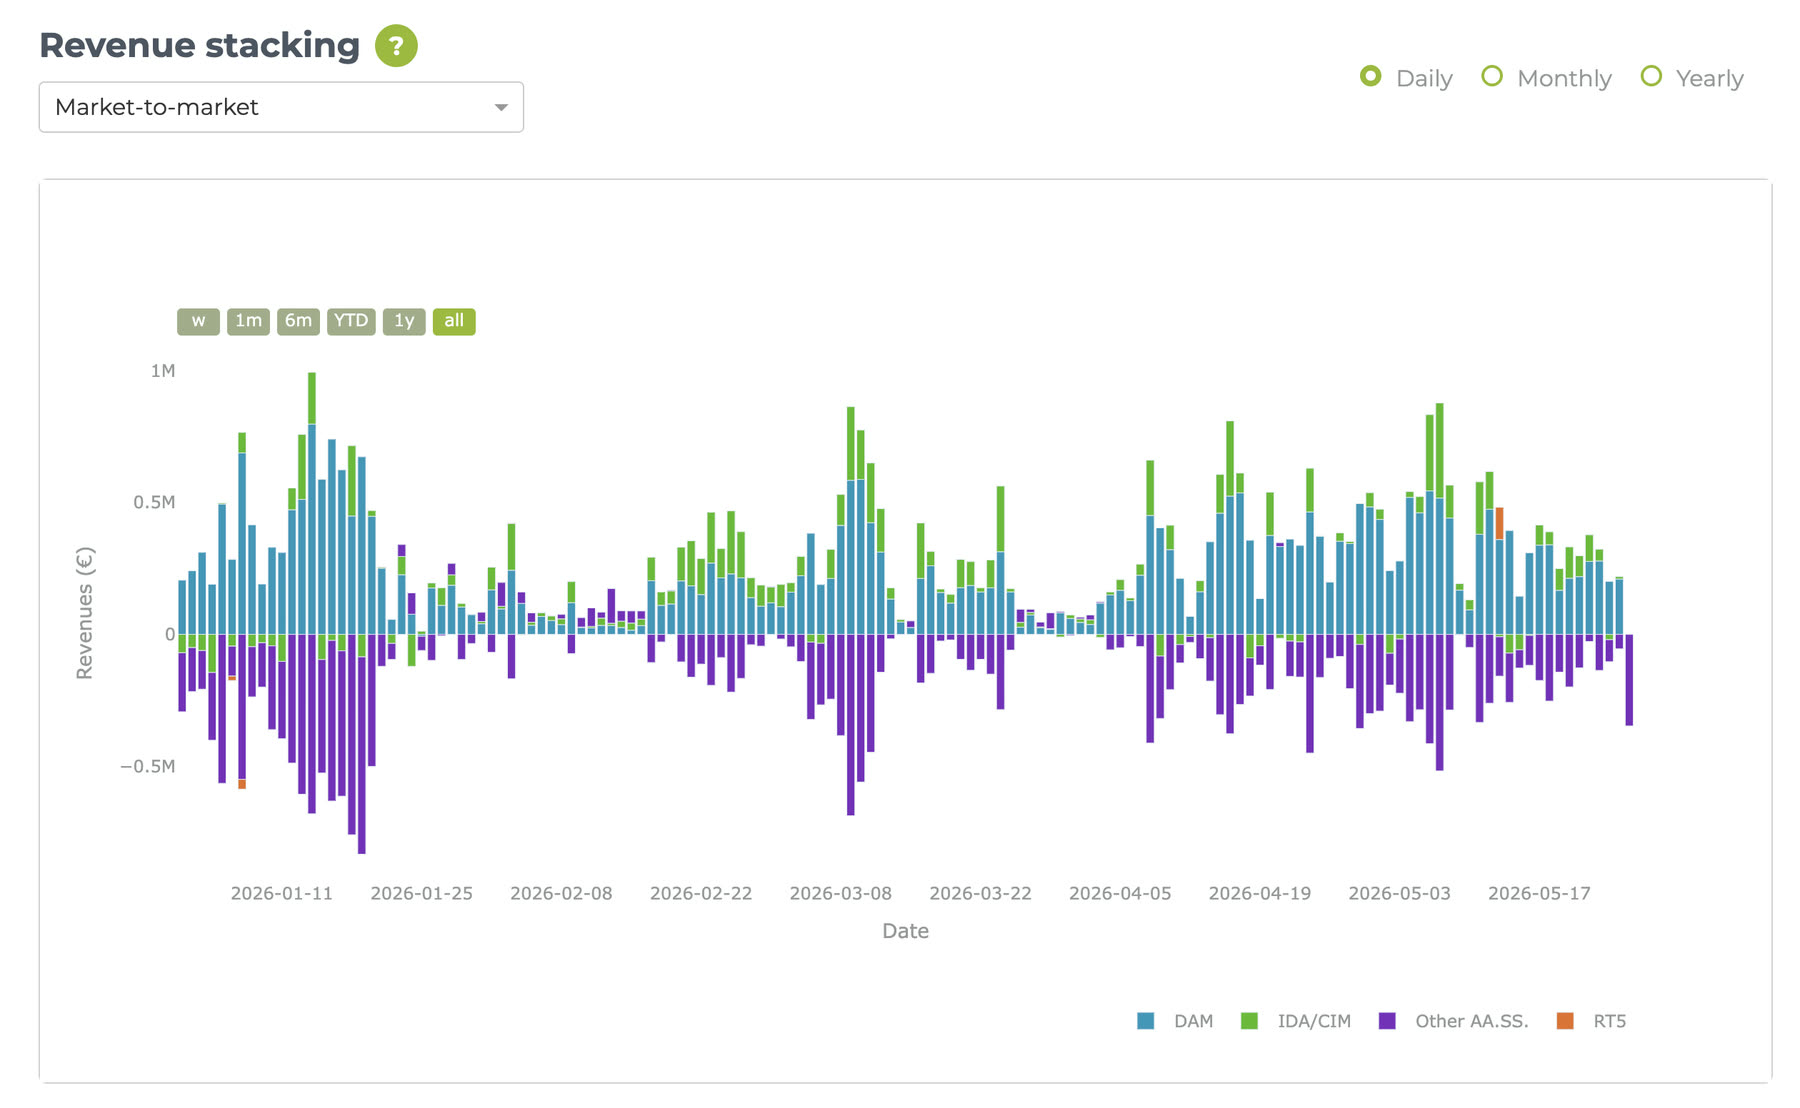
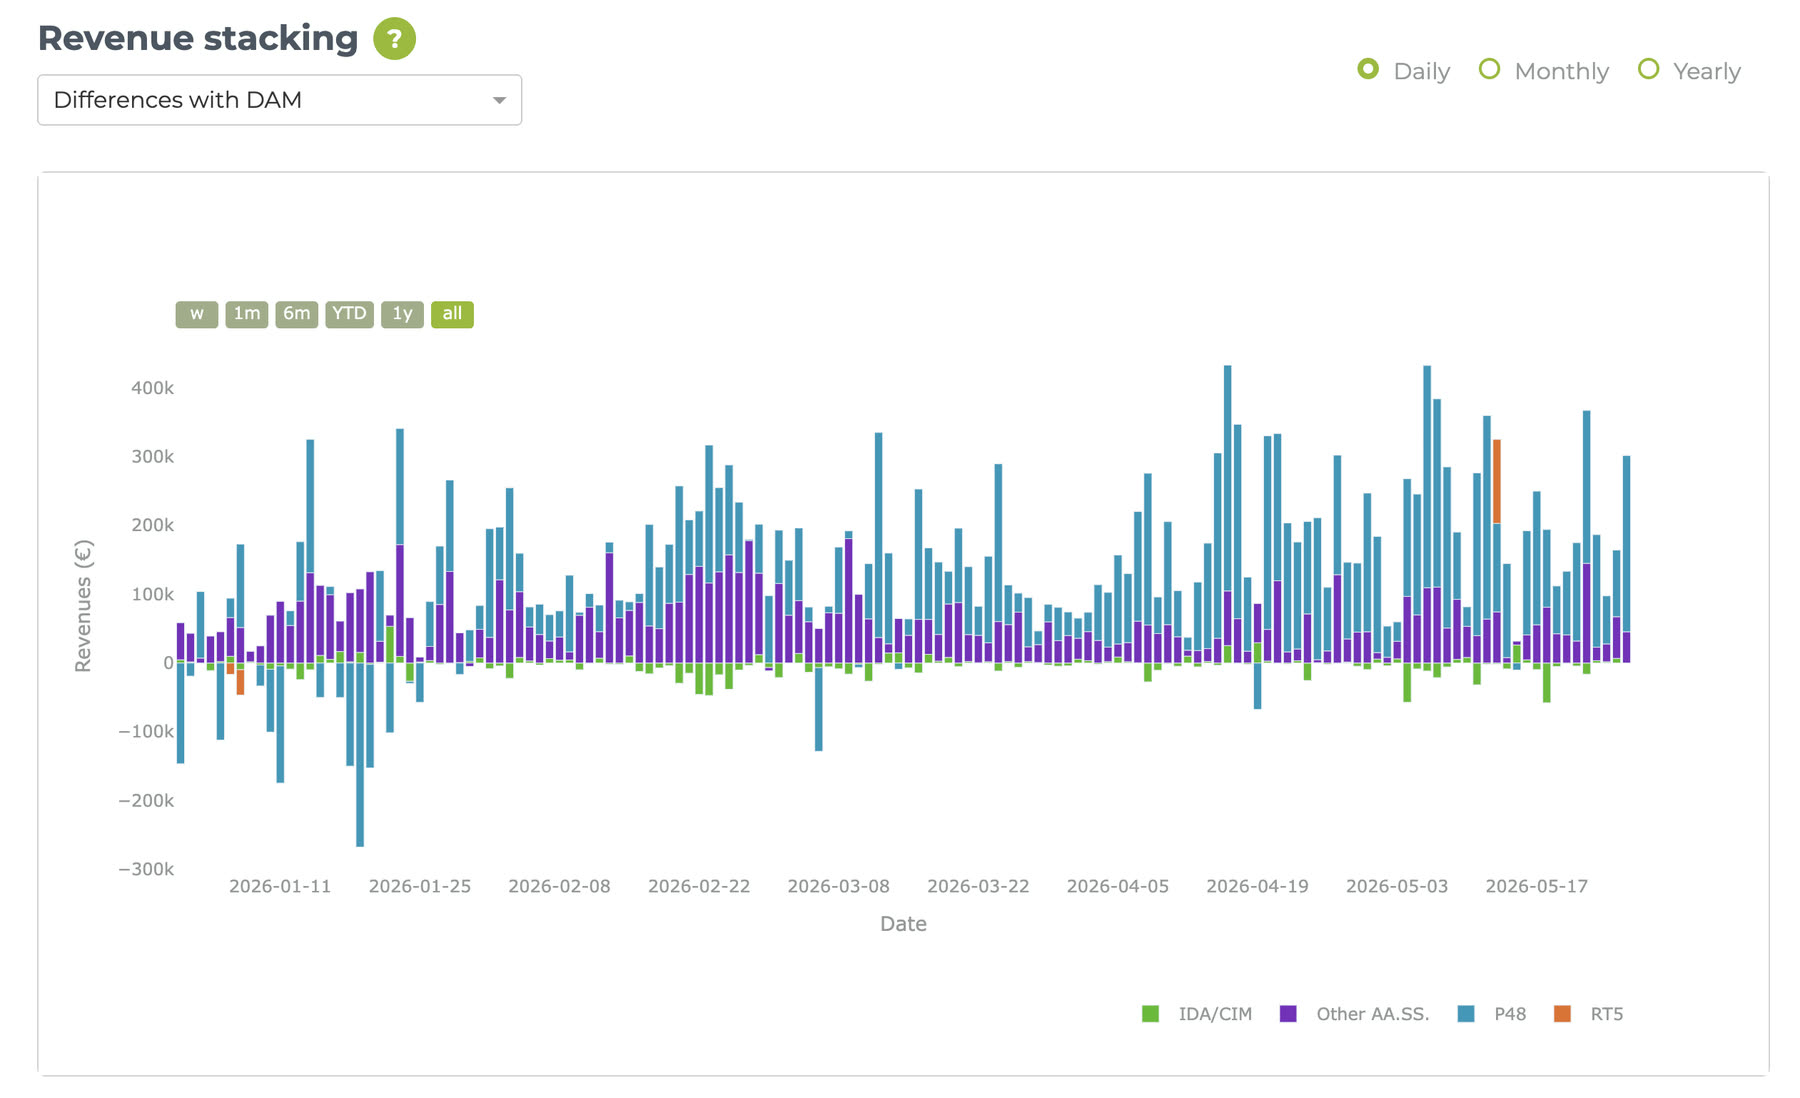
Where every euro comes from
Each asset’s revenue stacked market by market, day by day, and the difference against what the day-ahead market alone would have paid: how much taking part in intraday and balancing services really adds, operative against P48. With the gross-revenue ranking per asset, in € and in €/MW, and the comparison between assets, you know which ones are pulling the portfolio and which one needs a change of strategy.
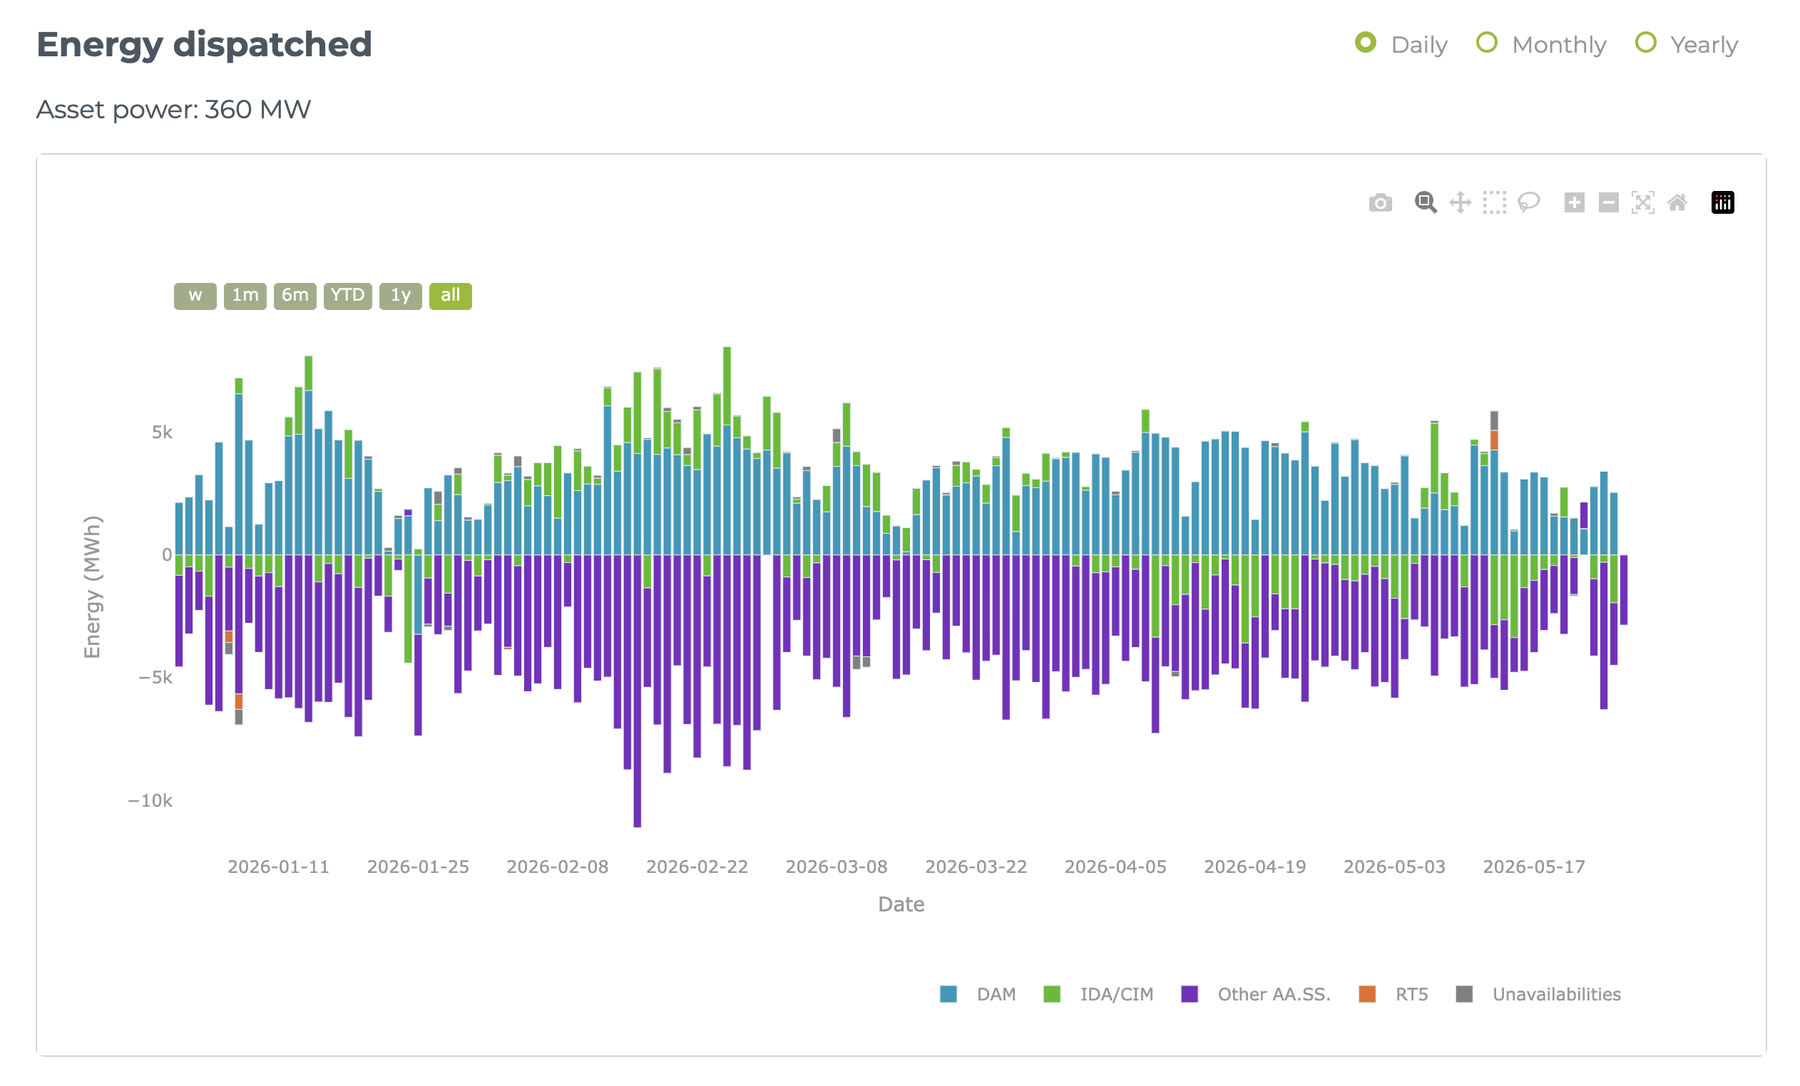
How much energy went, and to which market
Dispatched energy by day, month or year and market by market, across the OMIE markets (day-ahead and intraday / MIC) and the REE ones (technical restrictions, tertiary, secondary, RR and real-time restrictions), with unavailabilities kept apart. You see whether the volume is going to the markets that pay best and what every hour out of service is costing you.
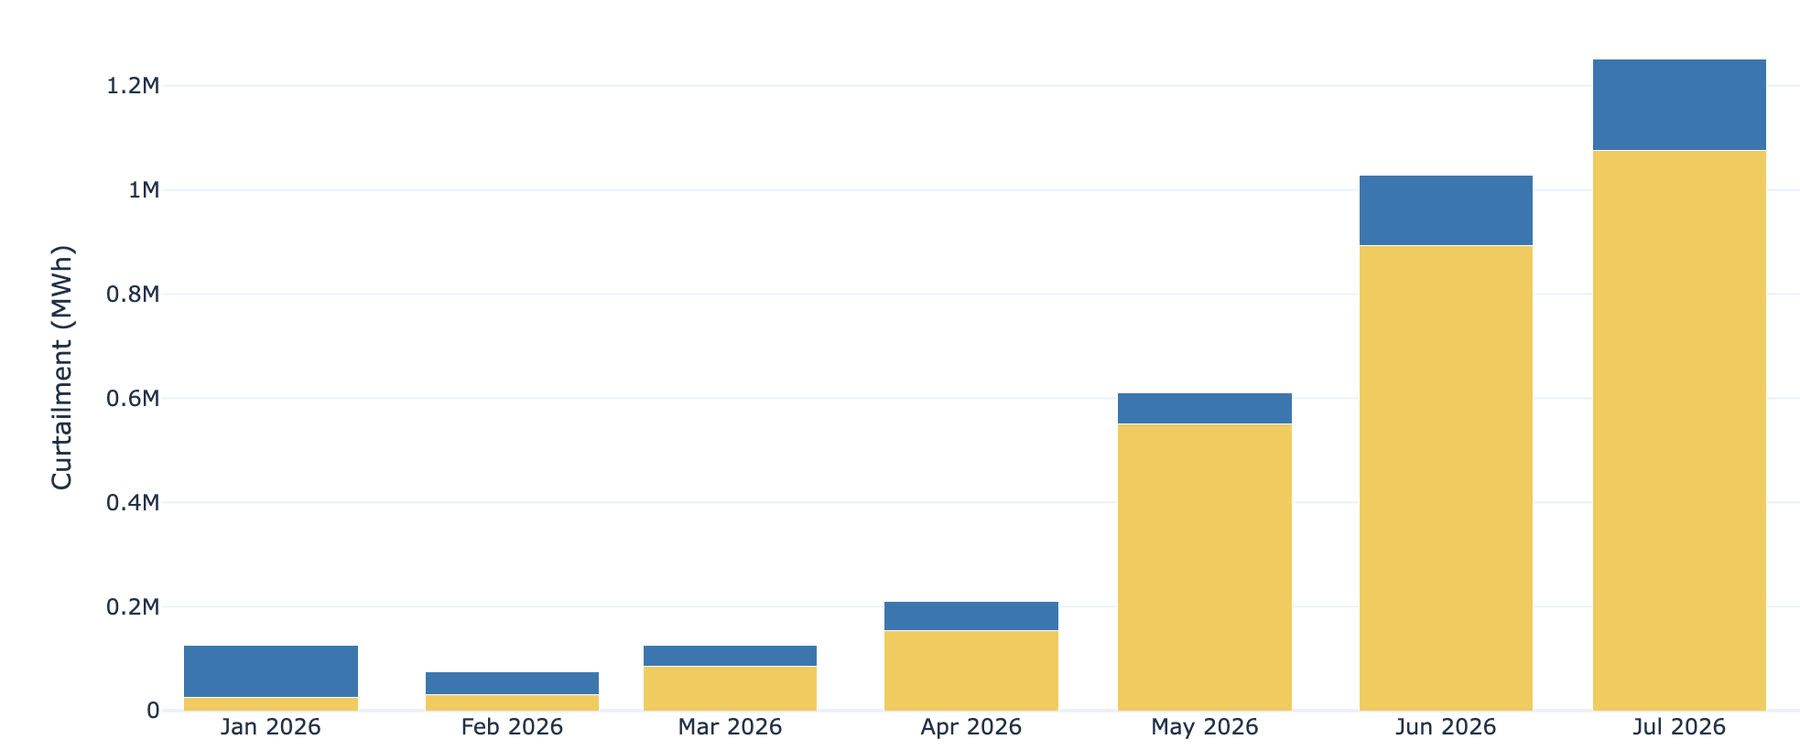
What the cuts are costing you
The history of curtailment and technical constraints by technology and scheduling unit, in volume and in lost revenue. With the energy left out month by month you can put a number on what each site is losing and decide whether hybridisation, storage or a change of node pay for themselves.
What the regulation band is worth
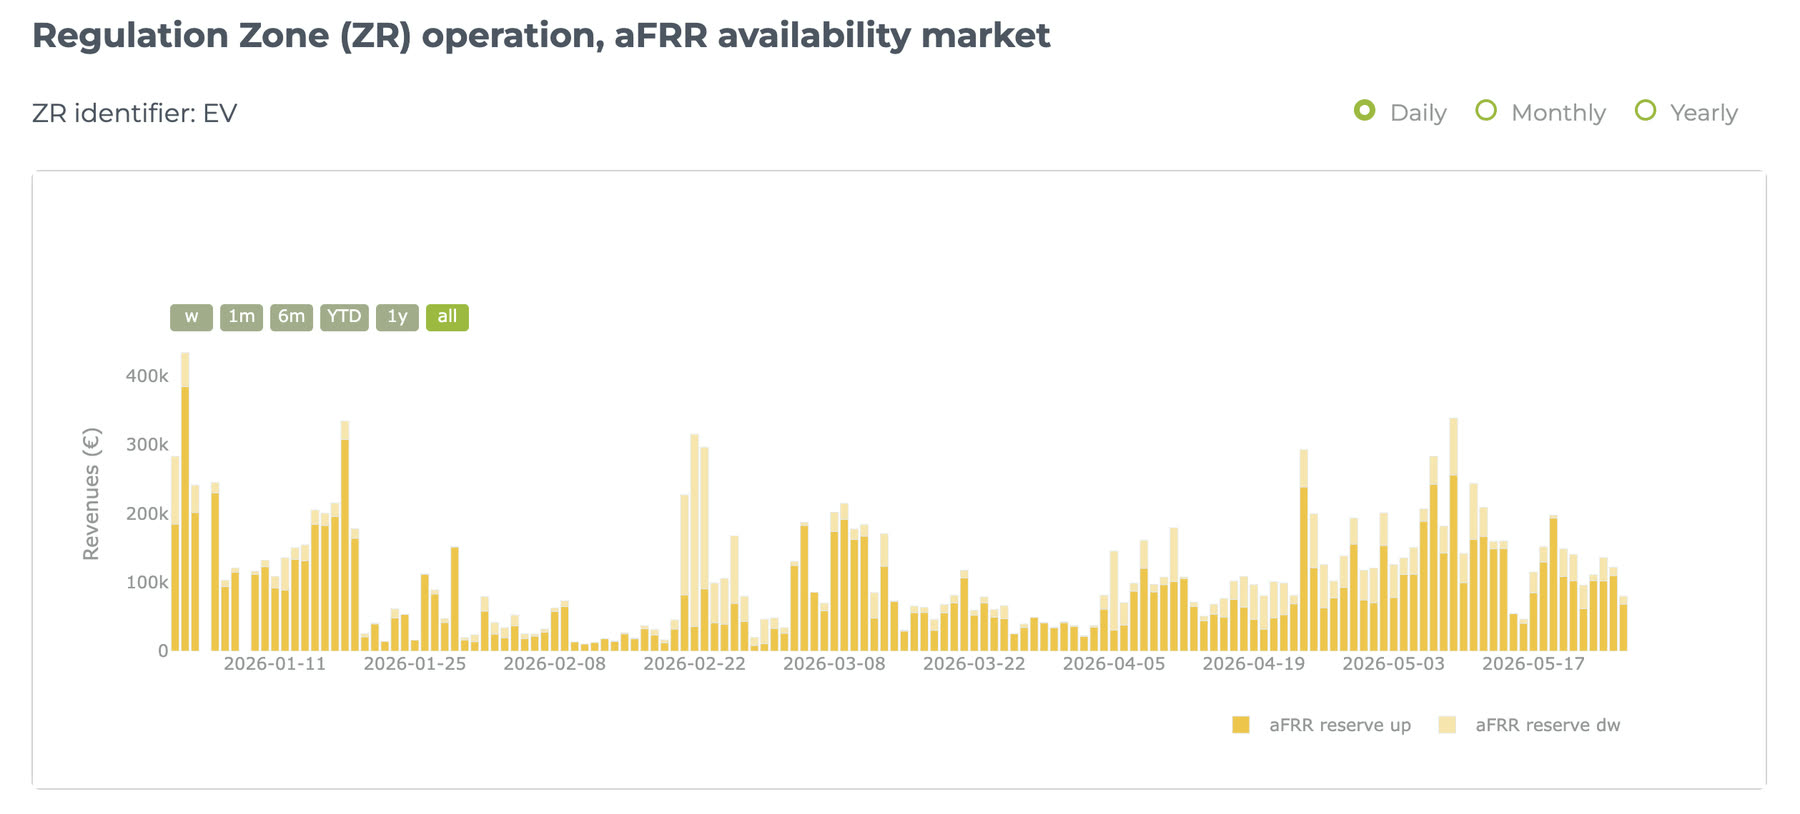
The revenue of your regulation zone in the aFRR availability market, splitting upward from downward reserve, day by day. You see how much of the margin comes from being available rather than from producing, and whether it pays to reserve capacity for the band instead of pouring it all into the day-ahead market.
The market you compete in, not just your assets
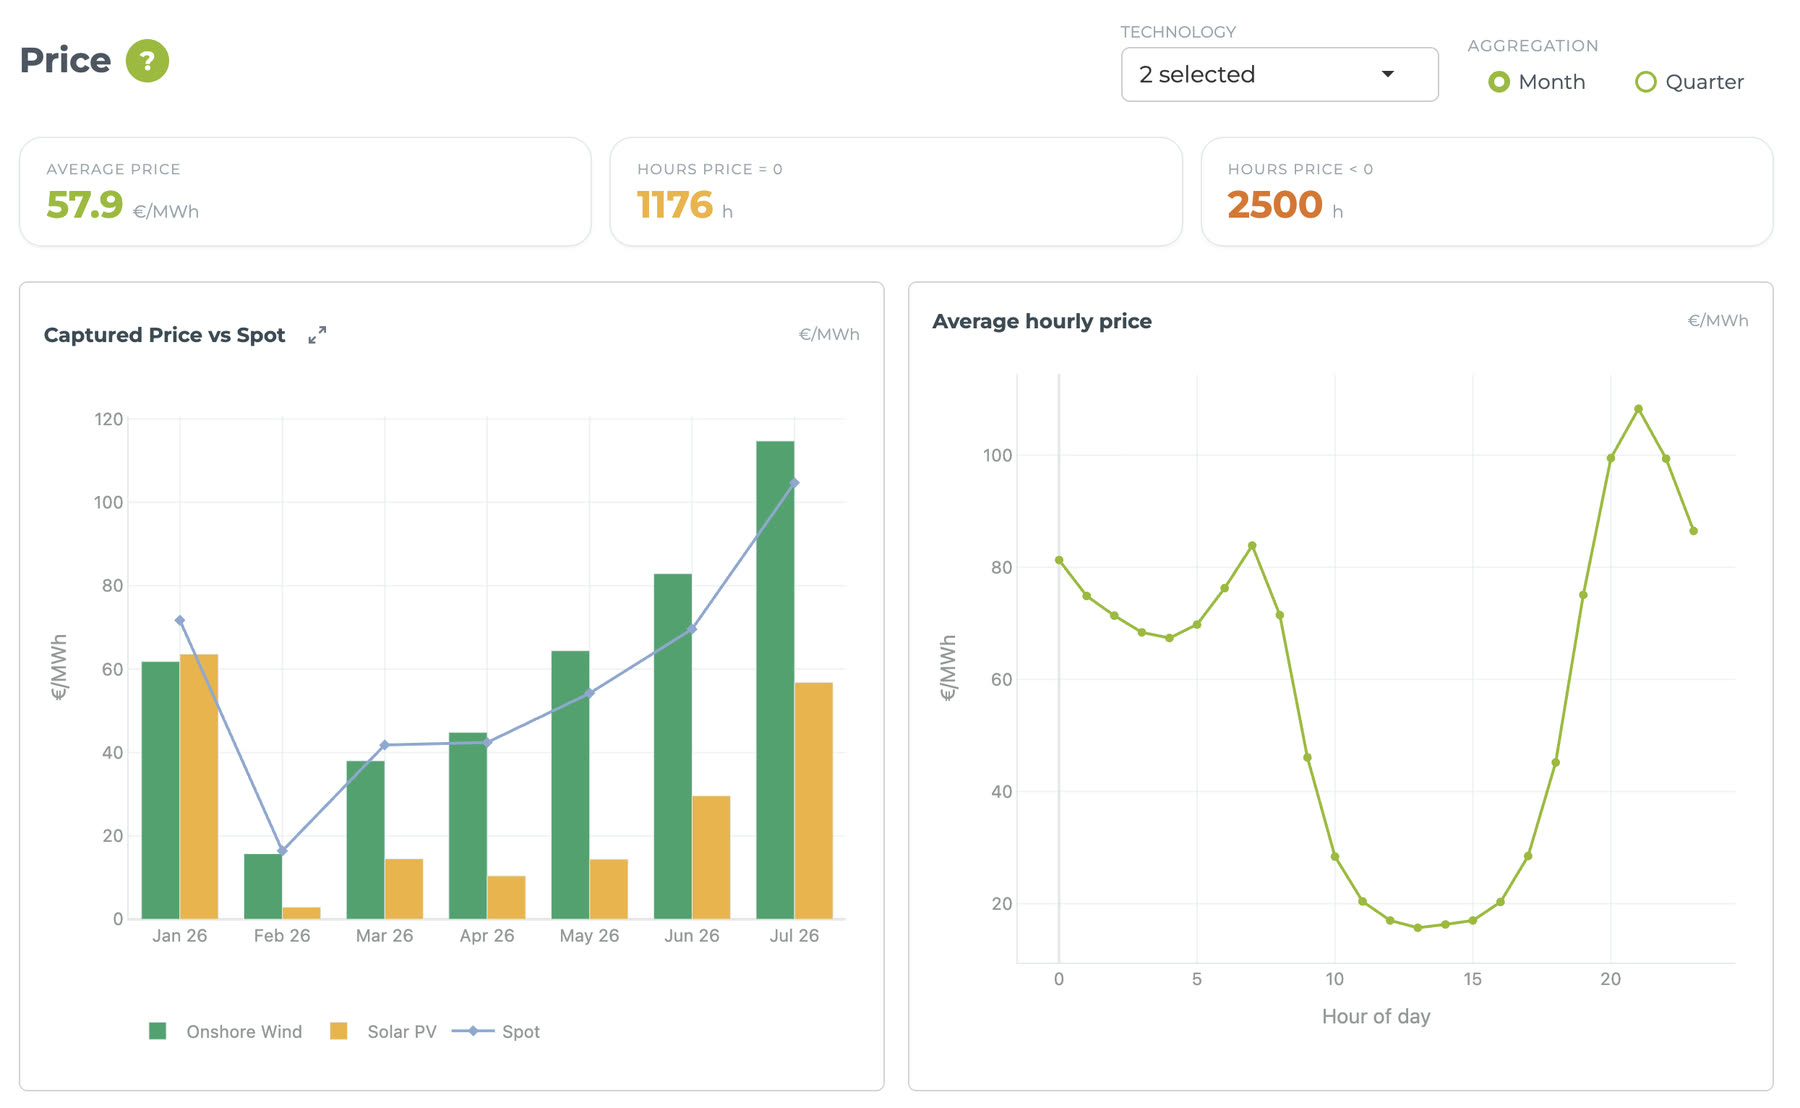
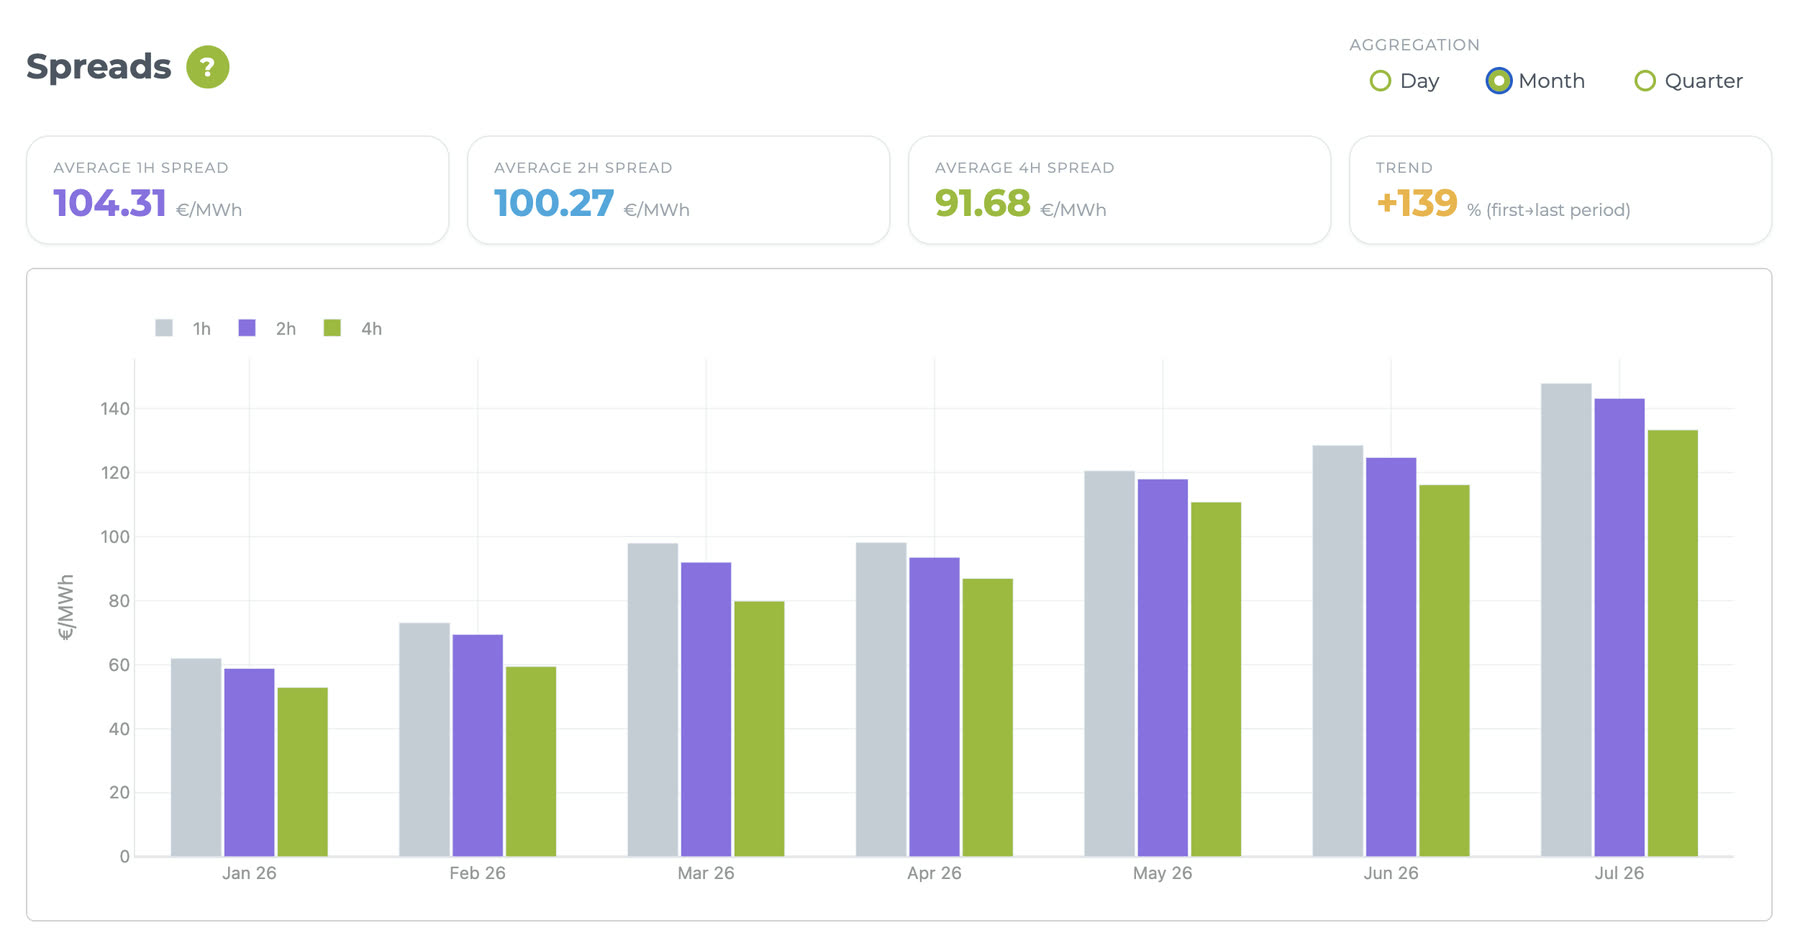
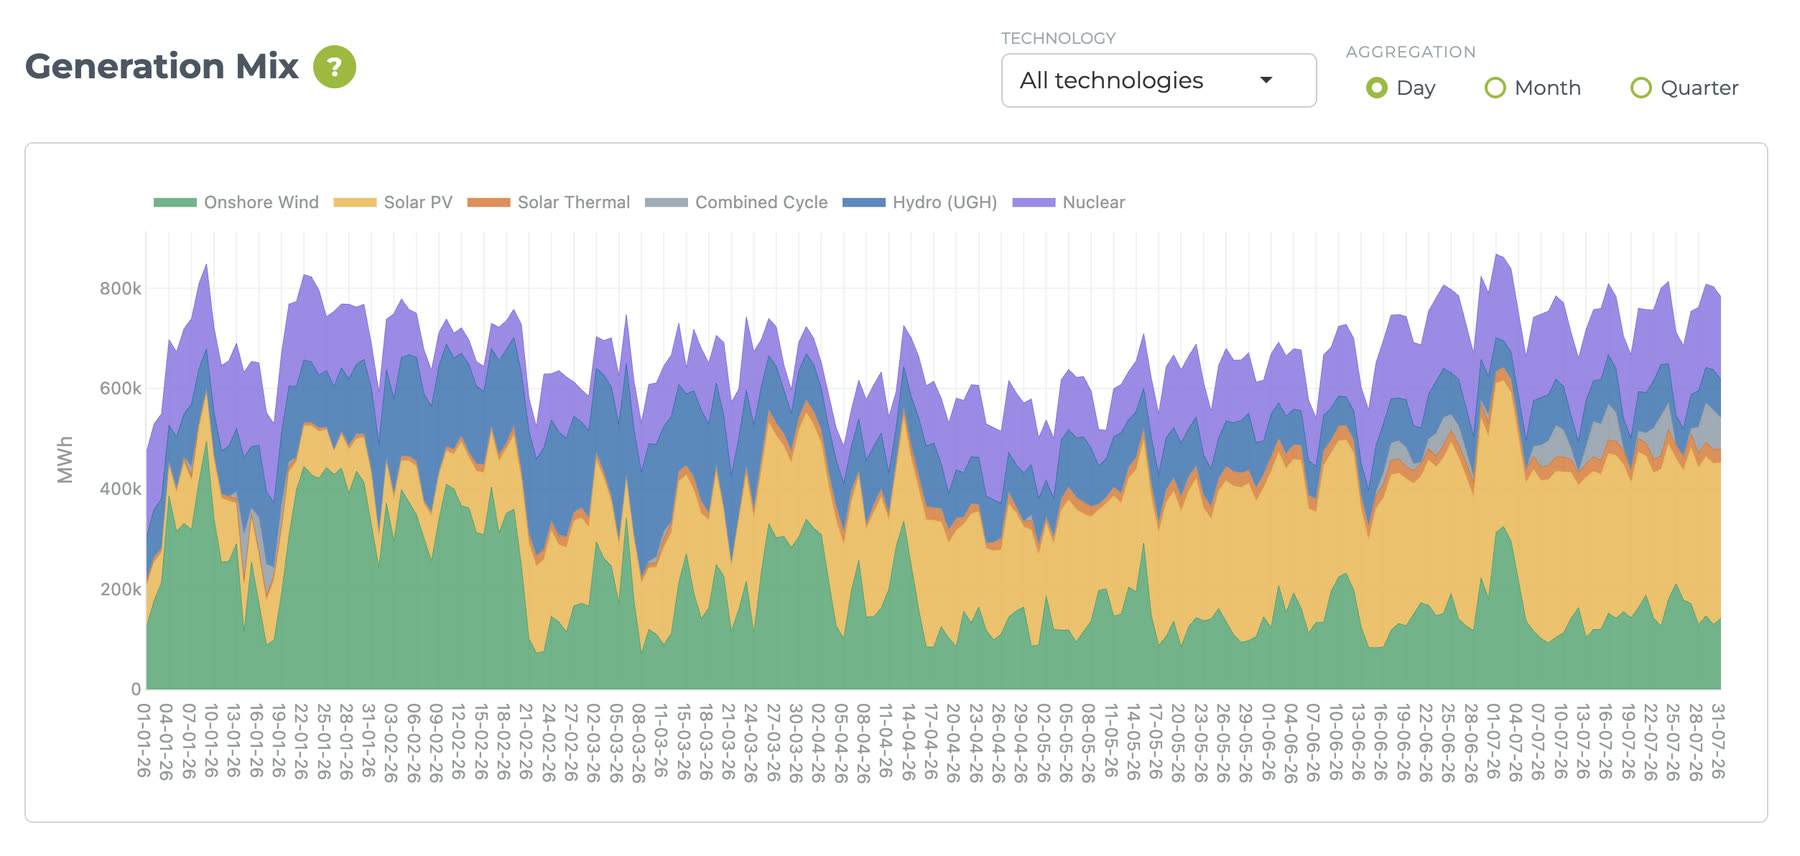
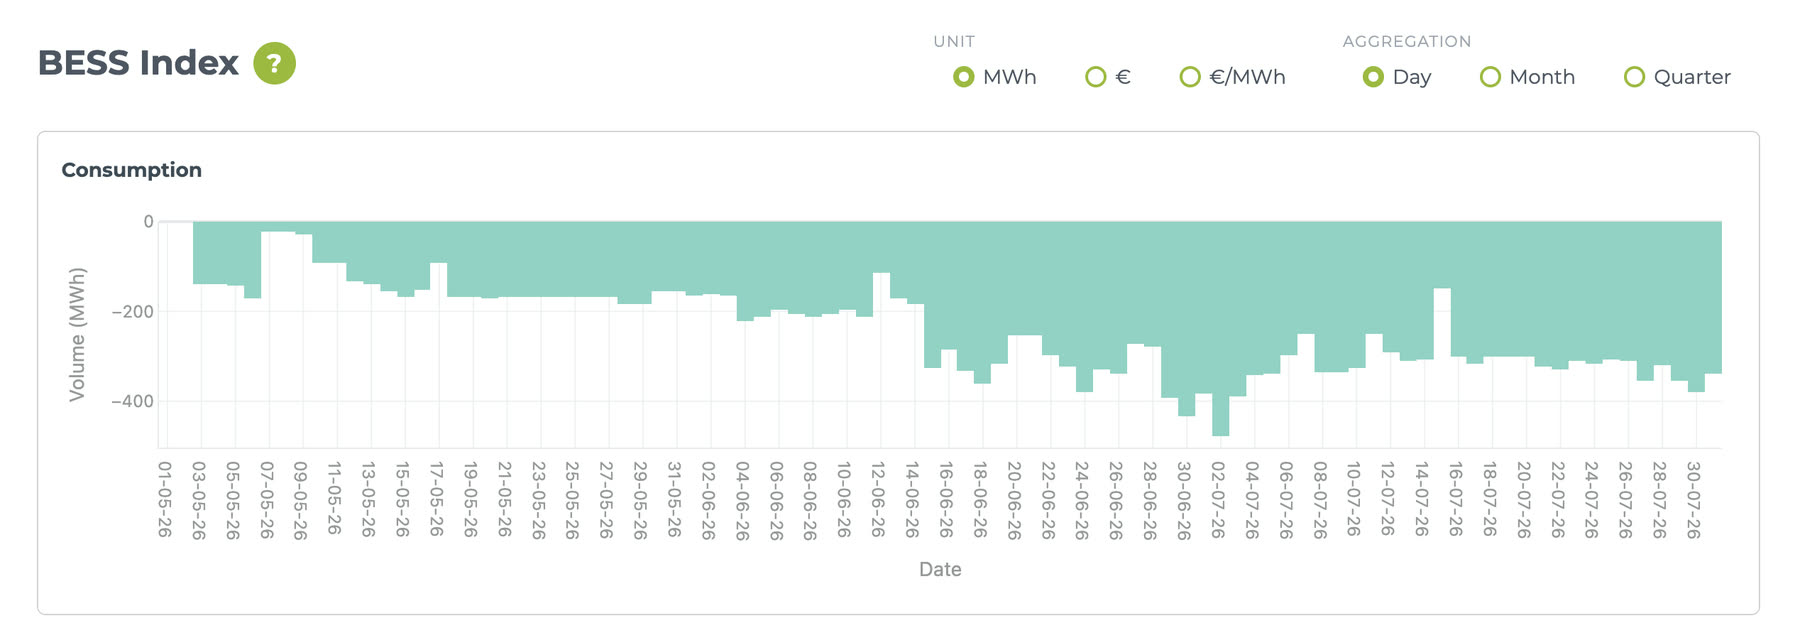
Market statistics by technology: captured price against spot, the hourly price profile, spreads, the generation mix and the BESS index. So far this year the system has piled up 1,176 hours at zero price and 2,500 at a negative price, and the average daily spread is up 139 %: the numbers that explain why your captured price is falling and why storage starts to add up. Here your assets are not measured on their own, they are measured against what their technology did.
Energy Tracker™
What sets us apart
Exclusive data access
Official, real-time data directly from the market operators.
Actionable insights
Understand asset performance with in-depth revenue analytics and market comparisons.
User-friendly
Personalized accounts and flexible access for monitoring and managing the assets.
Data-driven decisions
Your team makes strategic decisions based on the latest trends and detailed analytics.
The market as the benchmark
Your assets are not measured on their own: they are measured against what their technology did in each market.
The services behind it
Our clients
































Want to see your assets in Energy Tracker?
Ask for a demo and we will show you the revenue and energy detail of your assets across electricity markets.